
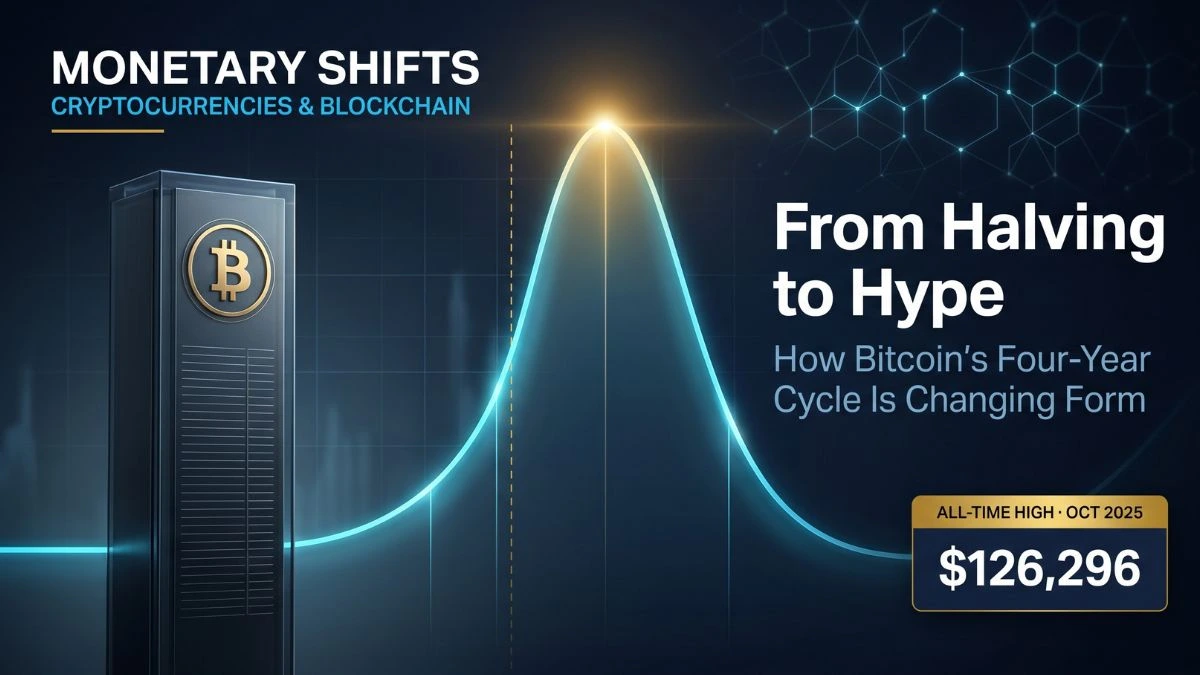
Bitcoin market cycles are the recurring, roughly four-year waves of accumulation, expansion, euphoria, and contraction that have shaped the asset since 2009. They matter because they convert a single supply rule — the halving — into a repeating pattern of capital flows, sentiment, and price discovery. Understanding them is the difference between reacting to noise and reading structure.
Introduction
Few patterns in modern finance are discussed as obsessively, or understood as poorly, as the Bitcoin market cycle. For more than a decade, the asset has appeared to move in a rhythm: a programmed supply cut known as the halving, followed by a long climb, a speculative blow-off, and a punishing drawdown — only for the sequence to begin again. Investors have treated this four-year clock almost as a law of nature.
Yet the most recent cycle has complicated the story. Bitcoin reached an all-time high near $126,296 on October 6, 2025, then entered a drawdown exceeding fifty percent within months — one of the largest in its history — while on-chain valuation never reached the euphoric extremes of past peaks. The “sacred” four-year cycle is now openly questioned by analysts at firms such as Fidelity Digital Assets.
This guide explains how Bitcoin market cycles actually work: the mechanics of the halving, the four phases markets pass through, the on-chain indicators professionals use to locate the present moment, and the macro forces — global liquidity, interest rates, and institutional flows — that increasingly drive the pattern. It connects the Bitcoin market cycle to the broader monetary system, and it confronts the central question now facing every serious allocator: is the Bitcoin market cycle still intact, or has it changed form?
What Are Bitcoin Market Cycles?
What Is a Bitcoin Market Cycle?
A Bitcoin market cycle is the repeating sequence of accumulation, uptrend, euphoria, and decline that Bitcoin’s price has historically followed over roughly four years. It is anchored to the halving — a programmed cut in new supply every 210,000 blocks — and amplified by investor psychology, liquidity conditions, and, increasingly, institutional capital.
The cycle is not a guarantee written into code. The only thing the protocol enforces is the issuance schedule. Everything else — the price expansion, the mania, the crash — is an emergent behavior produced by humans responding to a known, shrinking supply against fluctuating demand. This distinction is critical. The halving is deterministic; the Bitcoin market cycle is probabilistic.
Historically, the pattern has been remarkably legible. After each of the first three halvings (2012, 2016, 2020), Bitcoin reached a new all-time high within roughly twelve to eighteen months, then surrendered the majority of those gains in a drawdown that often exceeded seventy-five percent. The 2018 and 2022 bear markets each saw declines beyond eighty percent from peak. For a generation of investors, this became the template.
The deeper logic resembles a credit cycle more than a stock chart. New money enters during the climb, leverage builds, narratives detach from fundamentals, and the eventual unwind purges that excess. Bitcoin simply runs this loop faster and more visibly than most assets, because its supply side is fixed and its ownership is transparent on a public ledger. For readers new to the asset class, our cryptocurrency market for beginners guide provides the foundational context this analysis builds upon.
The Halving: The Engine of the Cycle
At the center of every Bitcoin cycle sits a single mechanical event. Approximately every four years — precisely every 210,000 blocks — the reward paid to miners for adding a block to the blockchain is cut in half. This is the halving, and it is the closest thing Bitcoin has to a monetary policy committee, except that it answers to no one and cannot be revised.
The numbers are exact and verifiable. Bitcoin’s fourth halving occurred on April 20, 2024, at block height 840,000, reducing the block subsidy from 6.25 BTC to 3.125 BTC. In practical terms, daily new issuance fell from roughly 900 BTC to about 450 BTC, and annual issuance dropped from approximately 328,500 BTC to around 164,250 BTC. The schedule and the underlying code can be reviewed directly at Bitcoin.org.
| Halving | Date | Block Height | Subsidy Before → After | Approx. Annual Issuance After |
|---|---|---|---|---|
| First | Nov 2012 | 210,000 | 50 → 25 BTC | ~1,314,000 BTC |
| Second | Jul 2016 | 420,000 | 25 → 12.5 BTC | ~657,000 BTC |
| Third | May 2020 | 630,000 | 12.5 → 6.25 BTC | ~328,500 BTC |
| Fourth | Apr 2024 | 840,000 | 6.25 → 3.125 BTC | ~164,250 BTC |
| Fifth (est.) | Apr 2028 | 1,050,000 | 3.125 → 1.5625 BTC | ~82,125 BTC |
The strategic significance is not the single day of the cut but the permanent shift in supply flow that follows. After April 2024, Bitcoin’s annual supply inflation rate fell to roughly 0.8 percent — below the long-run growth rate of above-ground gold, typically estimated between one and two percent. This is why Bitcoin is frequently framed in the same conversation as hard money and gold; both derive monetary credibility from supply that cannot be expanded at will. Readers tracing that lineage may find our analysis of the gold standard and the modern monetary system relevant here.
Crucially, the marginal impact of each halving shrinks. After April 2024, more than ninety-three percent of all bitcoin that will ever exist had already been mined. The 2028 halving will reduce issuance further, but from a smaller base. This mathematical decay is central to one of the most important debates in the asset class — diminishing returns — which we examine below.
The Four Phases of a Bitcoin Cycle
Market practitioners typically divide each cycle into four recognizable phases. The boundaries are fuzzy in real time and obvious only in hindsight, but the framework remains the most useful map of where capital and sentiment stand.
Accumulation. This is the quiet phase that follows a crash. Prices are flat or grinding sideways, public attention has evaporated, and volatility compresses to multi-year lows. Long-term holders accumulate from forced sellers and the exhausted. Historically, all-time-low volatility has preceded all-time-high prices — a pattern documented by Fidelity Digital Assets across the 2013, 2017, and most recent cycles.
Markup (the uptrend). Supply tightens in the wake of the halving while demand begins to recover. Price breaks out of its range, momentum returns, and media coverage resumes. This phase can last twelve to eighteen months and contains the bulk of the Bitcoin market cycle’s gains.
Euphoria (the hype). The defining and most dangerous stage. New entrants arrive en masse, leverage peaks, narratives detach from valuation, and “this time is different” becomes consensus. This is also when capital rotates most aggressively into smaller tokens — the dynamic behind our cycle-aware guide to the top altcoins to watch in 2026. On-chain profit metrics reach extremes. This is the “hype” in halving to hype — and historically the point of maximum financial risk, not maximum opportunity.
Distribution and decline. Smart money sells into strength, momentum stalls, and a cascade of liquidations accelerates the fall. The drawdown — often referred to as crypto winter — purges leverage and resets sentiment, returning the market to accumulation.
What makes the Bitcoin market cycle treacherous is that the emotional signal is inverted relative to the rational one. The safest entry points feel the worst; the most dangerous feel euphoric. This is why disciplined investors lean on data rather than sentiment to locate the phase, which brings us to on-chain analysis.
On-Chain Indicators: Reading the Cycle With Data
What Is the MVRV Ratio?
The MVRV (Market Value to Realized Value) ratio divides Bitcoin’s market capitalization by its realized capitalization — the aggregate value of every coin priced at the moment it last moved on-chain. An MVRV near 1.0 means the average holder is at breakeven; historically high readings have flagged cycle tops, and readings below 1.0 have marked cycle bottoms.
Because Bitcoin’s ledger is public, analysts can observe the behavior of holders in ways impossible for traditional assets. Several on-chain indicators have proven useful for locating a cycle’s position, and the most cited is MVRV, a metric built on realized capitalization, a concept formalized by Coin Metrics.
The historical record is instructive. MVRV peaked above 10 in 2013, near 8 in 2017, and around 7 in 2021 — with readings above 7 generally treated as the danger zone. At the October 2025 peak, MVRV reached only about 3.8 to 4.2, far below prior euphoric extremes. The full data series can be explored through analytics platforms such as Glassnode. This compression is one of the strongest pieces of evidence that the current cycle differs structurally from its predecessors.
Two complementary indicators round out the professional toolkit. SOPR (Spent Output Profit Ratio) compares the price at which coins are sold to the price at which they were acquired; a reading above 1.0 indicates the market is selling in aggregate profit, below 1.0 in loss, with 1.0 acting as a rough bull-bear dividing line. RHODL compares the realized value held by short-term versus long-term holders, helping identify when speculative newcomers dominate — a classic late-cycle signal. For a practical walkthrough of applying these metrics, see our guide to on-chain data for investors.
| Indicator | What It Measures | Cycle-Top Signal | Cycle-Bottom Signal |
|---|---|---|---|
| MVRV | Market value vs. realized value | Elevated (historically >7) | Below 1.0 |
| SOPR | Profit/loss on coins spent | Sustained well above 1.0 | Below 1.0 |
| RHODL | Short- vs. long-term holder value | Short-term holders dominate | Long-term holders dominate |
| Realized Cap | Total capital invested | Rising sharply | Flat/declining |
No single indicator is predictive in isolation, and each has been tested across only three completed bear markets, each with a different macro backdrop. Used together, however, they offer a far more disciplined read on cycle position than price or sentiment alone.
The Macro Layer: Liquidity, Rates, and the Dollar
For most of its history, Bitcoin’s market cycle was treated as a closed system driven by the halving and crypto-native psychology. That framing is now insufficient. As the asset has grown to a market capitalization of roughly $2.5 trillion at its October 2025 peak, it has become increasingly sensitive to the same macroeconomic forces that move global risk assets.
The dominant external driver is global liquidity — the combined balance-sheet posture of major central banks and the availability of credit in the financial system. When liquidity expands, capital flows toward the risk frontier, and Bitcoin sits at its far edge. When liquidity contracts, Bitcoin is among the first assets sold. The 2020–2021 expansion coincided with unprecedented monetary stimulus; the 2022 collapse coincided with the most aggressive tightening cycle in decades.
Interest rates set by the Federal Reserve are the clearest transmission mechanism. Higher rates raise the opportunity cost of holding a non-yielding asset and strengthen the dollar, both headwinds for Bitcoin. The relationship between inflation, monetary policy, and hard assets is now inseparable from any serious cycle analysis — a theme we develop in depth in our coverage of inflation and monetary policy. The Federal Reserve’s own policy statements, published at the Federal Reserve, have become required reading for crypto allocators.
This macro integration is double-edged. It exposes Bitcoin to forces beyond its supply schedule, which can override the halving narrative entirely — as appears to have happened in the most recent cycle, when macro deterioration in 2026 cut short the expected post-halving climb. But it also signals maturation: an asset that responds to liquidity and rates is an asset that institutions can model, hedge, and allocate to within conventional frameworks. That shift is itself reshaping the Bitcoin market cycle.
How Institutional Capital Is Reshaping the Cycle
How Did Bitcoin ETFs Change the Market Cycle?
The launch of U.S. spot Bitcoin ETFs in January 2024 created a permanent, regulated demand channel that did not exist in prior cycles. By absorbing post-halving supply through steady institutional inflows, ETFs have dampened volatility, compressed on-chain profit extremes, and may have muted the speculative euphoria that defined earlier cycle tops.
The single most important structural change to the Bitcoin cycle is the arrival of institutional money at scale. The approval of spot Bitcoin exchange-traded funds in January 2024 — for the first time letting pensions, endowments, and wealth platforms hold regulated Bitcoin exposure — rerouted demand through Wall Street’s distribution machinery. The mechanics of this shift are explored in our Bitcoin spot ETF analysis, which traces why the product was a genuine inflection point.
The flows are substantial. Bitcoin ETFs attracted roughly $21.8 billion in net inflows during 2025, with BlackRock’s iShares Bitcoin Trust (IBIT) dominating the category at over $66 billion in assets under management and around seventy percent of trading volume. Cumulative spot crypto ETF trading volume crossed $2 trillion in early 2026, less than two years after launch — doubling from $1 trillion in roughly half the time it took to reach the first milestone. Detailed flow data is tracked by research firms such as Galaxy Research.
This new demand channel changes the Bitcoin market cycle in three ways. First, it provides a persistent bid that absorbs the post-halving supply reduction more smoothly, dampening the violent supply shocks of earlier eras. Second, it imports traditional-finance behavior — dollar-cost averaging, rebalancing, long-duration holding — that is less prone to retail panic. Third, and most visibly, it appears to have compressed the euphoric blow-off: the October 2025 peak arrived with on-chain profit metrics far below historical extremes, suggesting the speculative mania phase was muted by steadier institutional ownership.
The implication is profound. If the Bitcoin market cycle’s amplitude is being flattened by institutional flows, then the patterns calibrated on three retail-driven cycles may no longer apply. That is the heart of the diminishing-returns debate.
Diminishing Returns and the “Is the Cycle Dead?” Debate
No question dominates current Bitcoin analysis more than whether the four-year cycle still functions. The evidence is genuinely mixed, and serious analysts disagree.
The case that the Bitcoin market cycle has broken rests on the most recent data. For the first time, Bitcoin failed to deliver the textbook post-halving outcome: rather than a sustained multi-month rally peaking twelve to eighteen months after the April 2024 halving, the asset reached its high in October 2025 and then fell more than fifty percent — a drawdown of roughly 52.5 percent over 122 days, the seventh-largest in its history. On-chain euphoria never materialized, with MVRV topping out near 4 rather than above 7. To proponents of this view, institutional integration and macro sensitivity have dissolved the old rhythm.
The case that the Bitcoin market cycle endures is equally grounded. Diminishing returns — smaller percentage gains with each successive cycle — are not evidence of failure but the expected mathematical consequence of a maturing, growing asset. A $2.5 trillion asset cannot replicate the percentage moves of a $10 billion one. On-chain analysts at firms like Fidelity Digital Assets note that the cyclical rhythm of accumulation and profit-taking remains visible in the data even as its amplitude compresses; the Bitcoin market cycle, in this reading, has not disappeared but changed form.
| Cycle | Halving | Approx. Peak | Time to Peak | Relative Gain | Peak MVRV |
|---|---|---|---|---|---|
| 1 | 2012 | Late 2013 | ~12 months | Largest | >10 |
| 2 | 2016 | Late 2017 | ~18 months | Large | ~8 |
| 3 | 2020 | Late 2021 | ~18 months | Moderate | ~7 |
| 4 | 2024 | Oct 2025 | ~18 months | Smallest | ~4 |
The honest synthesis is that both can be true at once. The deterministic supply mechanism still operates, and holder behavior still loops through accumulation and distribution. But the magnitude of each swing is being progressively muted by scale, institutional ownership, and macro integration. For investors, the practical lesson is to stop treating the four-year calendar as a predictive timer and start reading the Bitcoin market cycle through data and liquidity conditions instead.
What the Cycle Means for Investors
The cycle framework is most valuable not as a market-timing tool but as a discipline for managing expectations and risk. Three principles follow directly from the historical record.
First, the calendar is a guide, not a clock. The gap between halving and cycle top has ranged from twelve to eighteen months across three completed cycles, and the most recent peak deviated again. Treating any specific date as predictive is, in the words of one analyst, pattern-matching on a coin flip. Second, drawdowns are the norm, not the exception. Every prior bear market fell at least seventy-seven percent from its high; assuming the worst is over simply because the price has already halved ignores the historical base rate. Third, the safest accumulation feels worst and the riskiest euphoria feels best — which is precisely why systematic approaches like dollar-cost averaging tend to outperform discretionary timing.
For investors building a position, the Bitcoin market cycle argues for humility about prediction and rigor about process. The supply schedule is the one certainty; everything else is probability shaped by liquidity, sentiment, and now institutional flows. How these dynamics translate beyond Bitcoin is a separate question — our Ethereum vs Bitcoin long-term comparison examines why the two leading assets cycle differently.
People Also Ask
How long is a Bitcoin market cycle? A full Bitcoin market cycle has historically lasted roughly four years, anchored to the halving that occurs every 210,000 blocks. The cycle moves through accumulation, uptrend, euphoria, and decline, with the peak typically arriving twelve to eighteen months after a halving. The most recent cycle deviated somewhat, peaking in October 2025 before a sharp drawdown.
Does the halving cause Bitcoin’s price to rise? The halving does not directly cause price increases; it cuts new supply, which has historically coincided with rising prices when demand holds or grows. After April 2024, daily issuance fell from about 900 BTC to roughly 450 BTC. Price outcomes depend on demand, liquidity, and macro conditions, not the halving alone.
When is the next Bitcoin halving? The next Bitcoin halving is expected around April 2028, when the network reaches block height 1,050,000. At that point, the block subsidy will fall from 3.125 BTC to 1.5625 BTC, cutting annual issuance to roughly 82,000 BTC. The precise date depends on block-production speed and will become clearer as the milestone approaches.
What is the MVRV ratio used for? The MVRV ratio is used to gauge whether Bitcoin is over- or undervalued relative to the capital actually invested in it. Readings far above 1.0 — historically above 7 — have signaled cycle tops, while readings below 1.0 have marked bottoms. At the October 2025 peak, MVRV reached only about 4, far below prior euphoric extremes.
Is the four-year Bitcoin cycle over? Analysts disagree. The 2024–2025 cycle broke the textbook pattern, peaking earlier and with muted on-chain euphoria, leading some to declare the Bitcoin market cycle dead. Others argue the cyclical rhythm persists but with diminishing amplitude — a natural consequence of a maturing, institutionally owned asset rather than a structural failure.
How have ETFs affected Bitcoin cycles? Spot Bitcoin ETFs, launched in January 2024, created a permanent institutional demand channel that absorbs supply and imports steadier holding behavior. This appears to have dampened volatility and compressed the speculative euphoria of past cycle tops. Bitcoin ETFs drew roughly $21.8 billion in net inflows during 2025, led by BlackRock’s IBIT.
Conclusion
Bitcoin market cycles remain the most useful lens for understanding the asset’s behavior — provided they are read as probability rather than prophecy. The halving still anchors a recurring rhythm of accumulation, expansion, euphoria, and contraction, and on-chain indicators still trace that loop. What has changed is the Bitcoin market cycle’s amplitude: as Bitcoin matured into a multi-trillion-dollar asset integrated with global liquidity and owned increasingly through regulated institutional channels, its swings have compressed and its sensitivity to macro forces has grown. The four-year calendar is no longer a reliable timer.
The practical takeaway is to favor data over dates and process over prediction. To go deeper, explore our companion analyses on the Bitcoin spot ETF and the relationship between inflation and monetary policy.
Important Notice
This article is for educational and informational purposes only and does not constitute financial, investment, tax, or legal advice. Cryptocurrencies are highly volatile and carry substantial risk, including the potential loss of your entire investment. Historical cycle patterns are not predictive of future results. Nothing here is a recommendation to buy, sell, or hold any asset. Always conduct your own research and consult a qualified, licensed financial professional before making investment decisions.
Frequently Asked Questions
What exactly happens during a Bitcoin halving? A halving is a pre-programmed event in Bitcoin’s code that cuts the reward miners receive for adding a new block to the blockchain by fifty percent. It occurs every 210,000 blocks, roughly every four years. The most recent halving, on April 20, 2024, reduced the subsidy from 6.25 BTC to 3.125 BTC, lowering daily issuance from about 900 BTC to roughly 450 BTC. The mechanism requires no votes or human intervention — it is enforced automatically by the network’s consensus rules and verifiable by any node operator. Its purpose is to enforce scarcity by slowing the rate at which new bitcoin enters circulation, progressively approaching the protocol’s hard cap of 21 million coins.
Why do Bitcoin cycles seem to follow the halving so closely? The relationship is partly mechanical and partly psychological. Mechanically, the halving reduces new supply at a predictable moment, so if demand stays constant or rises, upward price pressure tends to follow. Psychologically, the halving is a widely anticipated event that focuses investor attention and reinforces a self-fulfilling narrative of scarcity and opportunity. Across the first three cycles, this combination produced a new all-time high within twelve to eighteen months of each halving. However, the correlation is not causation: liquidity, interest rates, and institutional demand have increasingly shaped outcomes, and the 2024–2025 cycle showed that the halving alone cannot guarantee the historical pattern.
What is the difference between the halving and the Bitcoin market cycle? The halving is a deterministic, code-enforced event: a supply cut that happens on schedule regardless of market conditions. The cycle is an emergent, probabilistic pattern of human behavior — accumulation, uptrend, euphoria, and decline — that has historically formed around each halving but is not guaranteed by it. Confusing the two is a common error. The protocol enforces only the issuance schedule; the price cycle is the result of millions of participants reacting to that schedule against a backdrop of shifting demand, leverage, sentiment, and macroeconomic conditions. This is why the cycle can vary in timing, magnitude, and even shape.
How do professional analysts identify where we are in a cycle? Professionals rely heavily on on-chain indicators rather than price alone, because Bitcoin’s public ledger reveals holder behavior directly. The most referenced is MVRV, which compares market value to the capital actually invested; readings historically above 7 have flagged tops and below 1.0 have marked bottoms. Complementary metrics include SOPR, which shows whether the market is selling in profit or loss, and RHODL, which reveals whether short-term speculators or long-term holders dominate. No single metric is predictive in isolation, and each has been validated across only three completed bear markets, so analysts combine them with liquidity and macro analysis to triangulate cycle position.
Why are Bitcoin’s market cycle returns getting smaller? Diminishing returns are primarily a function of scale. When Bitcoin was a niche asset worth a few billion dollars, modest capital inflows could produce enormous percentage gains. As a multi-trillion-dollar asset, it requires vastly more capital to move the same percentage, so each successive cycle has delivered smaller relative gains and lower on-chain profit extremes. This is widely interpreted not as failure but as the natural maturation of a growing asset. The pattern parallels how any asset class behaves as it scales and attracts institutional ownership: volatility and outsized returns compress as liquidity and participation deepen.
Could the four-year cycle disappear entirely? It is plausible that the recognizable four-year pattern continues to fade even if it does not vanish. The forces compressing it — institutional ownership through ETFs, integration with global liquidity, and the shrinking marginal impact of each halving — are structural and likely to intensify. Some analysts argue the cycle has already broken, citing the muted 2024–2025 peak; others contend the underlying rhythm of accumulation and distribution persists with smaller amplitude. The most defensible position is that the deterministic supply mechanism endures while the dramatic, retail-driven boom-bust swings progressively flatten as the market matures.
How does global liquidity affect Bitcoin’s market cycle? Global liquidity — the combined balance-sheet posture of major central banks and the availability of credit — has become one of Bitcoin’s most powerful drivers. As a high-beta risk asset, Bitcoin tends to rise when liquidity expands and capital flows toward the risk frontier, and to fall sharply when liquidity contracts. The 2020–2021 boom coincided with unprecedented monetary stimulus, while the 2022 collapse aligned with aggressive central-bank tightening. This sensitivity means Federal Reserve policy and the broader credit cycle can amplify or override the halving narrative, as appears to have happened when macro deterioration cut short the expected post-halving climb.
Is dollar-cost averaging better than timing the cycle? For most investors, systematic dollar-cost averaging — investing fixed amounts at regular intervals — tends to outperform attempts to time the cycle, because the cycle’s emotional signals are inverted relative to its rational ones. The safest accumulation points feel the most uncomfortable, arriving during quiet, low-volatility periods after a crash, while the most dangerous moments feel euphoric. Precisely timing tops and bottoms has proven extraordinarily difficult even for professionals, given that the halving-to-peak interval has varied and the most recent cycle deviated from precedent. A disciplined, rules-based approach removes emotion and reduces the risk of buying the top or capitulating at the bottom.
What role do miners play in the cycle? Miners are structurally important because their economics shift dramatically at each halving. When the block subsidy is cut, miner revenue from new issuance halves overnight, pressuring less efficient operations to upgrade equipment, relocate to cheaper power, or shut down. This can temporarily reduce network hashrate until difficulty adjusts. Over the long term, Bitcoin is designed to transition network security from block subsidies toward transaction fees as issuance shrinks toward zero. Miner selling behavior also affects short-term supply: when miners sell less of their newly mined bitcoin — as observed during the 2024 cycle amid ETF-driven demand — sell pressure eases, subtly supporting price.
How does Bitcoin’s market cycle compare to traditional market cycles? Bitcoin’s market cycle resembles a compressed, amplified credit cycle more than a typical equity cycle. Like credit cycles, it features a build-up of leverage and optimism followed by a purging contraction, but Bitcoin runs the loop faster and more transparently because its supply is fixed and its ownership is visible on a public ledger. Traditional markets are influenced by earnings, monetary policy, and economic growth; Bitcoin historically responded primarily to its halving and crypto-native sentiment. As institutional adoption deepens, however, Bitcoin’s market cycle is converging toward traditional risk-asset behavior, becoming more sensitive to liquidity and rates and less driven purely by its internal supply clock.

About Financial Cryptarch
Financial Cryptarch is the Founder of Criptocurrencie and a finance professional with over 15 years of experience in Accounting and Corporate Finance. Holding a Bachelor’s Degree in Accounting and an MBA in Corporate Finance, he focuses on cryptocurrencies, macroeconomics, global finance, and international geopolitics, helping readers understand the forces shaping money, markets, and economic power.


