On-Chain Data for Investors: Metrics Every Crypto Investor Should Track
On-chain data for investors is the practice of reading blockchain-native information — wallet balances, coin movements, and spending behavior — to gauge market health before price reacts. Unlike price charts, these metrics reveal what holders are actually doing, helping investors identify accumulation, distribution, and cycle extremes with verifiable, transparent evidence.
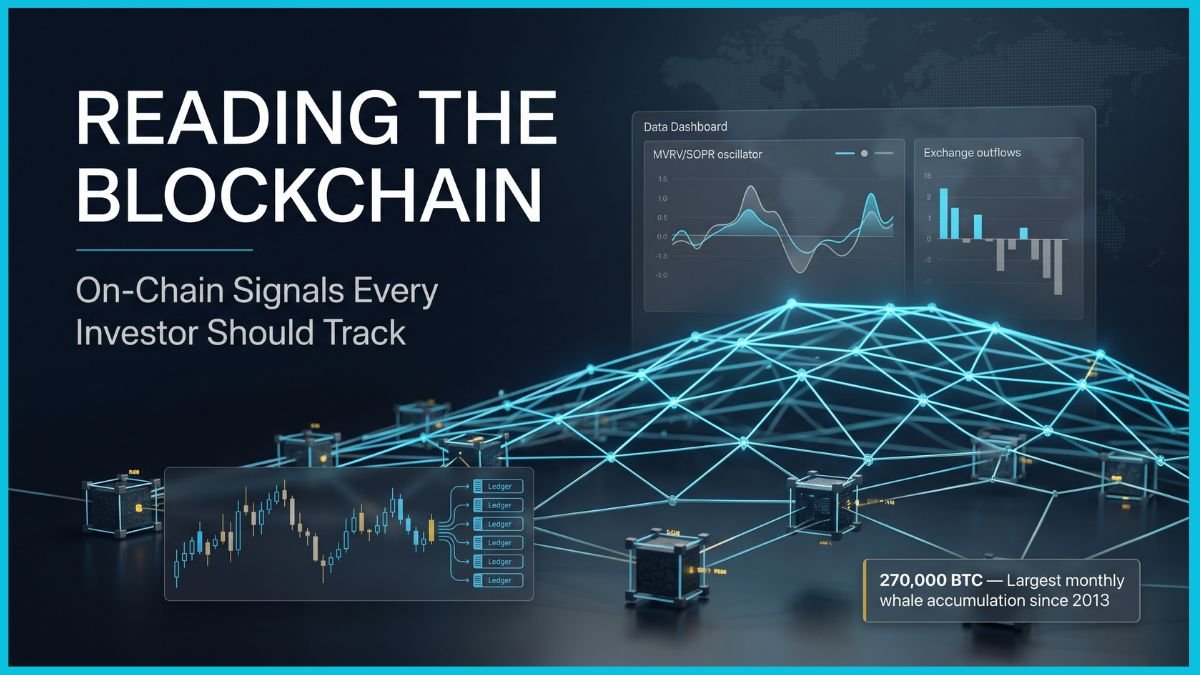
Most investors stare at candlestick charts and miss the deeper signal. Price tells you what already happened; on-chain data for investors often hints at what is about to happen. Every transaction settled on a public blockchain leaves a permanent, auditable record — and that ledger has become one of the most powerful analytical edges in modern markets. In early 2026, this edge proved its worth: while the Fear & Greed Index sat in extreme fear and headlines declared crypto dead, on-chain analysts watched whale wallets quietly absorb 270,000 BTC in a single month, the largest haul since 2013. This guide walks through the core metrics professional analysts rely on, how to read them, and why they matter for disciplined, long-term positioning rather than speculation.

About Financial Cryptarch
Financial Cryptarch is the Founder of Criptocurrencie and a finance professional with over 15 years of experience in Accounting and Corporate Finance. Holding a Bachelor’s Degree in Accounting and an MBA in Corporate Finance, he focuses on cryptocurrencies, macroeconomics, global finance, and international geopolitics, helping readers understand the forces shaping money, markets, and economic power.